WARNING: This website is obsolete! Please follow this link to get to the new Albert@Home website!
Project server code update |
Message boards :
News :
Project server code update
Message board moderation
Previous · 1 · 2 · 3 · 4 · 5 · 6 . . . 17 · Next
| Author | Message |
|---|---|
|
Richard Haselgrove Send message Joined: 10 Dec 05 Posts: 450 Credit: 5,409,572 RAC: 0 |
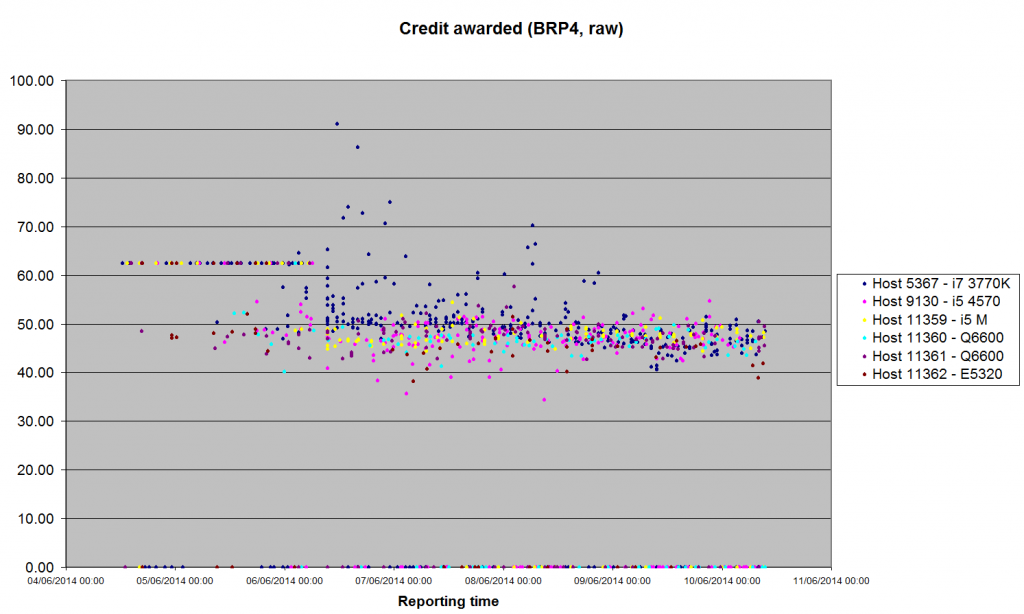
Having urged everyone to run GW/CasA over the weekend, I found I couldn't download any myself - and it looks like we're running low on BRP4 too. But I managed to get a good run of BRP4 validated (and continuing), so I dug out the trusty old graphing tool. http://i1148.photobucket.com/albums/o562/R_Haselgrove/AlbertCreditNewBRP4.png That shows the effect and variability of CreditNew in what is - supposedly - the best-case scenario: single-threaded CPU applications. I can only easily plot my own reporting time on the X-axis, which is far from ideal for spotting trends (many validations come much later) - but it gives a visual indication of what we're up against. |
 Bernd Machenschalk Bernd MachenschalkVolunteer moderator Project administrator Project developer Send message Joined: 15 Oct 04 Posts: 1956 Credit: 6,218,130 RAC: 0 |
Having urged everyone to run GW/CasA over the weekend, I found I couldn't download any myself - and it looks like we're running low on BRP4 too. Sorry, S6CasA was still throttled due to the validator issues. Has been fixed. The BRP4 WUG should get new data every 12h, currently there are >3000 BRP4 tasks unsent. BM |
|
Richard Haselgrove Send message Joined: 10 Dec 05 Posts: 450 Credit: 5,409,572 RAC: 0 |
I've been asked to dig out some statistics from that graph I posted earlier. These are the same six hosts, with a few extra validations since this morning, and the 62.50 flat-rate credit results stripped out. Host: 5367 9130 11359 11360 11361 11362 i7-3770 i5-4570 i5 M Q6600 Q6600 Xeon E5320 Credit for BRP4 Maximum 91.08 54.74 54.43 52.32 57.67 52.09 Minimum 40.66 34.40 44.37 40.19 42.77 38.25 Average 50.80 47.13 47.74 46.63 47.38 45.50 Median 49.58 47.29 47.58 46.75 47.41 45.58 Std Dev 6.18 3.23 1.70 1.93 2.28 2.85 Completed 369 169 118 74 136 59 APR 3.55845 3.19964 1.61535 2.33970 2.05929 1.20705 I'm not sure I believe that Std Dev, but Excel is insistent. |
|
Holmis Send message Joined: 4 Jan 05 Posts: 104 Credit: 2,104,736 RAC: 0 |
Following Richard's example I've put together plots of the credit awarded to host 2267 since the server upgrade. Plot of credit for BRP4X64, ARP=4.13 Plot of credit for BRP4G, ARP=58.02 Plot of credit for S6CasA, ARP=3.14 And finally if anyones interested here's the Excel document with both the data and plots. To summaries: BRP4X64 is all over the place but "always" lower than the fix credit before the upgrade. BRP4G took a nose dive and is slowly recovering, at least it appears to be going in the right direction. S6CasA only has 9 validated tasks so cant really tell but seems to be like BRP4X64. |
|
jason_gee Send message Joined: 4 Jun 14 Posts: 109 Credit: 1,043,639 RAC: 0 |
Hi All, Thanks very much guys, That'll he very helpful. Even though we've characterised a lot of the instabilities (and isolated some sources) I'm still surprised, by the CPU applications in particular, to see 3 standard deviations covering from tightest example ~+/-10% (unstable but not all that bad) right up through some ~+/- 37% in the worse examples. The engineering aspects are there in code, but it makes a big difference to see them in actual numbers, Thanks again, Jason |
|
Richard Haselgrove Send message Joined: 10 Dec 05 Posts: 450 Credit: 5,409,572 RAC: 0 |
Surprised in which direction - wider spread than you expected, or narrower? On the one hand, I think there's evidence in the graphs that the initial spread was wide, but quite quickly narrowed significantly. My guess is that would be repeated every time a project released a new app_version. On the other hand, I certainly ran my hosts quite intensively on BRP4 over the weekend, and I run them 24/7 with a stable mix of tasks. My results probably insert relatively little instability into the database, and here on a test project with few active participants, I suspect the same applies to other users too. In the rough-and-tumble of a production project, would the variability be greater? I've switched to concentrate on GW/CasA today, and I'll grab some data from the users who have started on GPU work already. |
|
jason_gee Send message Joined: 4 Jun 14 Posts: 109 Credit: 1,043,639 RAC: 0 |
Surprised in which direction - wider spread than you expected, or narrower? Surprised in how well the (lackadaisical) response of the system matches predictions of established engineering control systems theory... and that anyone would sample stochastic ('natural world' noisy) data, hook it up to hard logic, and expect a stable system to result.... apparently without consulting a single control systems engineer. As of now *to me*, the purposes of credit and RAC are for quantifying work, and for comparing against other hosts. In those contexts you might see convergence for your individual machine... but for comparative purposes those numbers, say against my host, are not meaningful on a human level ... They are quite useful, however, in estimating the entropy resulting from bad design, and so what will be required to fix it. ( even though we can probably redefine the terms entropy and chaos to include mashing noise together to make some guesses, I suspect my interpretations of the purpose of credit as a measure of work are long obliterated by the current system, and require extensive correction) |
|
Richard Haselgrove Send message Joined: 10 Dec 05 Posts: 450 Credit: 5,409,572 RAC: 0 |
I didn't understand a word of that :P (well the words, maybe, but not the sentences) Preliminary stats now I've got the GW framework set up (very preliminary - only 26 results validated): Host: 5367 9130 11359 11360 11361 11362 i7-3770 i5-4570 i5 M Q6600 Q6600 Xeon E5320 Credit for GW-CasA Maximum 262.35 290.46 0.00 294.04 223.03 330.82 Minimum 214.65 200.24 0.00 259.35 196.81 255.91 Average 237.06 241.14 #DIV/0! 277.81 209.92 295.37 Median 238.77 228.51 #NUM! 280.04 209.92 299.38 Std Dev 15.45 30.16 #DIV/0! 17.45 18.54 37.62 |
|
jason_gee Send message Joined: 4 Jun 14 Posts: 109 Credit: 1,043,639 RAC: 0 |
Surprised in which direction - wider spread than you expected, or narrower? I'll add, after private communications, that apparently there was some level of consultation during design &/or implementation of the system.... but that apparently that credit and work estimates would be intimately connected was not raised. I accept that the interpretations I have that both Credit and Time estimates are abstract 'human tools' separate from the computation, is probably a relatively novel contribution to that overall picture, and so that stability in perceived usefulness of those figures may not have been considered a big issue until well after the chaos had arisen (on other projects) |
|
jason_gee Send message Joined: 4 Jun 14 Posts: 109 Credit: 1,043,639 RAC: 0 |
I didn't understand a word of that :P (well the words, maybe, but not the sentences) Yep, there's that +/- 30% ( std dev x 3 )... let's see how she settles :) I didn't understand...... and that anyone would sample stochastic ('natural world' noisy) data, hook it up to hard logic, and expect a stable system to result.... i.e. Garbage in -> Garbage out. http://en.wikipedia.org/wiki/Garbage_in,_garbage_out [Edit:] choice new sig: On two occasions I have been asked, "Pray, Mr. Babbage, if you put into the machine wrong figures, will the right answers come out?" ... I am not able rightly to apprehend the kind of confusion of ideas that could provoke such a question. |
|
Richard Haselgrove Send message Joined: 10 Dec 05 Posts: 450 Credit: 5,409,572 RAC: 0 |
Oh, you're going to love this one Jason Holmis Claggy Zombie Zombie (Mac) Host: 11363 2267 9008 6490 6109 GTX 780 GTX 660 GT 650M TITAN GTX 680MX Credit for BRP4G (GPU) Maximum 1170.48 1036.86 10239.0 1654.85 11847.50 Minimum 115.82 88.84 153.90 25.79 94.88 Average 548.33 463.98 3875.88 874.96 2256.70 Median 468.80 390.21 2977.38 865.33 1591.80 Std Dev 431.90 268.52 2873.26 362.30 2395.61 I'll upload a graph after lunch, when my monitor has cooled down and I've stopped laughing. |
|
Holmis Send message Joined: 4 Jan 05 Posts: 104 Credit: 2,104,736 RAC: 0 |
Noticed that I've been assigned tasks from 2 "new" applications, BRP5 tasks for both Intel and Nvidia GPU. Non of those has an established APR so got another shot at the initial estimates. Here's some numbers from my client_state.xml: Intel GPU: <flops>581007031069.074340</flops> That's 581 GFlops! Boinc reports it @ 147 GFlops peak in the startup messages. Nvidia GPU: <flops>12454544406626.100000</flops> That's 12454 GFlops or 12,45 TeraFlops! Boinc reports it @ 2985 GFlops peak in the startup messages. And the APR for the BRP4G Nvidia tasks is 58.1 GFlops when running 2 at a time. If the BRP5 app gets the same APR then the initial speed estimate is that the card is 214 times as fast as it actually is!!! Question: How come the system estimates both resources to be much faster than what Boinc reports as their peak speed? Where's the logic in that? All downloaded BRP5 task comes with <rsc_fpops_est>450000000000000.000000</rsc_fpops_est> or 450000 GFpops. Crunching the numbers gives time estimates for the Intel GPU app @ 774,5 seconds or 12m54s. The 1st task has been running for 12m55s and reached 1,8% done... For the tasks assigned to the Nvidia card the estimate is 36 seconds. First 2 tasks has been running for 1h8m and reached about 30% done... I've resorted to add a few zeros to the <rsc_fpops_bound> to prevent Boinc from aborting the tasks with "maximum time limit exceeded". |
|
jason_gee Send message Joined: 4 Jun 14 Posts: 109 Credit: 1,043,639 RAC: 0 |
...Question: The initial GPU guesses seem to rely on Marketing flops figures with some sortof scaling. There is coarse error there because achieving anywhere near rated peak GFlops on a GPU is extremely challenging... i.e. it's a guess, and not a very good one. Then, basically after the first 11 completed, is where you enter control systems theory and 'averaging' (using the term 'averaging' loosely, because that part's quite incorrectly implemented). Unfortunately in the current mechanism there are a number of identified instabilities. As soon as you introduce instabilities into a feedback control system, you basically either push it completely off the rails, oscillate (either in simple patterns or chaoitic ones), or fail to converge completely & just get garbage. Something like this video of the famous Tacoma narrows Bridge collapse. You could ask similar questions like "Where is the logic in building a bridge like that ?", and "That bridge looked pretty stable yesterday, why'd it do that ?": http://www.youtube.com/watch?v=j-zczJXSxnw The answers probably lie in the designers not completely understanding the nature of the engineering problems at the time (quite understandable), and being caught quite off guard ... after all we've been building bridges for a very long time... [Edit:] LoL, "Gallopin' Gertie" ... that's gonna stick :P On two occasions I have been asked, "Pray, Mr. Babbage, if you put into the machine wrong figures, will the right answers come out?" ... I am not able rightly to apprehend the kind of confusion of ideas that could provoke such a question. - C Babbage |
|
Richard Haselgrove Send message Joined: 10 Dec 05 Posts: 450 Credit: 5,409,572 RAC: 0 |
All downloaded BRP5 task comes with <rsc_fpops_est>450000000000000.000000</rsc_fpops_est> or 450000 GFpops. What Jason said. To which I'd add: once you have 11 tasks validated, at the next work fetch all the runtime estimates, including for work already downloaded and cached, will jump up to something approaching reality. At this point, you may find that you have too much work to complete within deadline. I'd strongly advise you to manage work fetch carefully to start with, using either NNT or by deselecting the new applications in preferences, so you don't overshoot the mark. |
|
Holmis Send message Joined: 4 Jan 05 Posts: 104 Credit: 2,104,736 RAC: 0 |
The initial GPU guesses seem to rely on Marketing flops figures with some sortof scaling. There is coarse error there because achieving anywhere near rated peak GFlops on a GPU is extremely challenging... i.e. it's a guess, and not a very good one. Might there be a typo in there that multiplies rater than divides or just a missed sign? It feels like the scaling goes in the opposite direction of what it's supposed to. I've been following some of the discussion on the Seti-boards about this credit system and the code walk and look forward to the testing of an hopefully more stable and functional system here. I understand that it's difficult to say but is there a timetable for when we start testing what hopefully is improvements to the system? |
|
jason_gee Send message Joined: 4 Jun 14 Posts: 109 Credit: 1,043,639 RAC: 0 |
The initial GPU guesses seem to rely on Marketing flops figures with some sortof scaling. There is coarse error there because achieving anywhere near rated peak GFlops on a GPU is extremely challenging... i.e. it's a guess, and not a very good one. Basically If you overestimate the speed of the device, then you underestimate the time it'll take ... so for example I started with 3 second estimates for hour+ GPU tasks, because combined effects of any (even small) slop in the base estimates, room for optimisation in the application (s), plus the way the self scaling is set up, will tend to introduce those coarse errors first, then the erratic noise after as things try in vain to self-correct. Simple effects can combine to look pretty complex :) Thanks for helping out :) Yeah it's actually been a fascinating study so far, and no doubts many challenges to come. [Edit:] timetable for first patch attempt is for sometime after Bernd's back from a break. No expectation that this first pass would solve every issue, but certainly should indicate quickly if we are poking at the right set of suspects. On two occasions I have been asked, "Pray, Mr. Babbage, if you put into the machine wrong figures, will the right answers come out?" ... I am not able rightly to apprehend the kind of confusion of ideas that could provoke such a question. - C Babbage |
zombie67 [MM] Send message Joined: 10 Oct 06 Posts: 130 Credit: 30,924,459 RAC: 0 |
Oh, you're going to love this one Just FYI, for the machine with the TITAN, I am running 3 GPU tasks and reserving two full CPU threads. For the GTX 680MX, I am running 2 GPU tasks and reserving two full CPU threads. Not sure that makes any difference for the purpose of this discussion. Just explaining why the run times are longer than they should be. Dublin, California Team: SETI.USA  |
|
jason_gee Send message Joined: 4 Jun 14 Posts: 109 Credit: 1,043,639 RAC: 0 |
Just FYI, for the machine with the TITAN, I am running 3 GPU tasks and reserving two full CPU threads. For the GTX 680MX, I am running 2 GPU tasks and reserving two full CPU threads. Not sure that makes any difference for the purpose of this discussion. Just explaining why the run times are longer than they should be. It will make an impact with respect to those initial estimates, and possibly take a bit longer to semi-stabilise after through the initial period. Thanks for the info. It's an important case for us to consider, as multiple tasks on even modest GPUs is becoming more common now that it's feasible with app_config and stock applications. I'm nearly ready to set some ambitious targets/goals for the patches, pending looking at Richard's funny graph(s). In the big picture I'm expecting a well damped response in the system fixes should keep tasks within estimated runtime bounds, even with more tasks than that per GPU, though I'll probably reserve final judgement on whether the server really needs to know more detail until after the first pass. On two occasions I have been asked, "Pray, Mr. Babbage, if you put into the machine wrong figures, will the right answers come out?" ... I am not able rightly to apprehend the kind of confusion of ideas that could provoke such a question. - C Babbage |
|
Richard Haselgrove Send message Joined: 10 Dec 05 Posts: 450 Credit: 5,409,572 RAC: 0 |
This one's really rather pretty, I think. 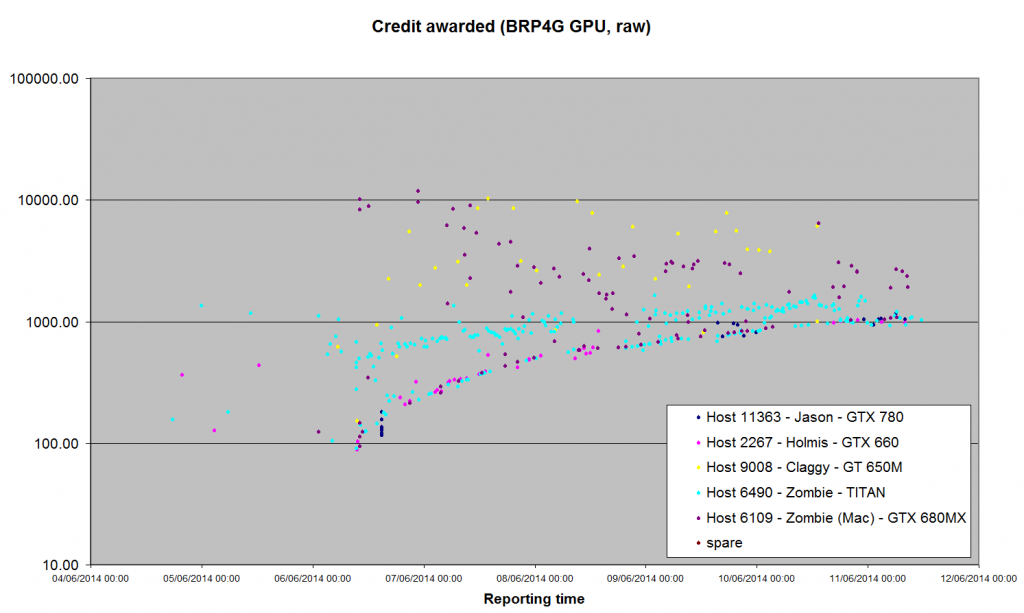 Note logarithmic credit scale :P |
|
jason_gee Send message Joined: 4 Jun 14 Posts: 109 Credit: 1,043,639 RAC: 0 |
Note logarithmic credit scale :P LoL. That's the same cheating as Eric did with the seti pfc_scales (as if I wouldn't notice :P) The cool thing about logarithmic scales is how they can make naturally varying things look smooth & stable.... Doesn't seem to have worked here completely though ;) [Edit:] going to stew on that, then set some targets for first pass, and longer term goals. Yep, everything seems to be matching what the Engineering and the code says... [Edit2:] just a funny observation looking at that then this data again: Credit for BRP4G (GPU) Maximum 1170.48 1036.86 10239.0 1654.85 11847.50 Minimum 115.82 88.84 153.90 25.79 94.88 Average 548.33 463.98 3875.88 874.96 2256.70 Median 468.80 390.21 2977.38 865.33 1591.80 Std Dev 431.90 268.52 2873.26 362.30 2395.61 Six sigma ( 6 x std deviations) of near or greater than the maximum is a worrying amount of entropy... On two occasions I have been asked, "Pray, Mr. Babbage, if you put into the machine wrong figures, will the right answers come out?" ... I am not able rightly to apprehend the kind of confusion of ideas that could provoke such a question. - C Babbage |
This material is based upon work supported by the National Science Foundation (NSF) under Grant PHY-0555655 and by the Max Planck Gesellschaft (MPG). Any opinions, findings, and conclusions or recommendations expressed in this material are those of the investigators and do not necessarily reflect the views of the NSF or the MPG.
Copyright © 2024 Bruce Allen for the LIGO Scientific Collaboration