WARNING: This website is obsolete! Please follow this link to get to the new Albert@Home website!
FGRP application v 1.07 (OPENCL) feedback thread |
Message boards :
Problems and Bug Reports :
FGRP application v 1.07 (OPENCL) feedback thread
Message board moderation
| Author | Message |
|---|---|
") Bikeman (Heinz-Bernd Eggenstein) Bikeman (Heinz-Bernd Eggenstein)Volunteer moderator Project administrator Project developer Send message Joined: 28 Aug 06 Posts: 1483 Credit: 1,864,017 RAC: 0 |
Dear all, I just released 10 different new app versions for FGRP#2, with version number 1.07: OSX OpenCL x (ati , nvidia) Win x (32 bit, 64 bit) x (ati, nvidia) Linux x (32 bit, 64 bit) x (ati, nvidia) This new version contains bug fixes only, performance should be the same as in previous version. Bugs addressed: - Failure to run on the correct GPU (the one assigned by the BOINC client) for hosts that have more than one OpenCL capable GPUs installed - Too verbose log output so that the beginning of the log would be truncated when uploaded to the server - Error handling was incomplete in previous version. So now you should be able to see in the results view of the web interface that the app logs the brand/type of the graphics card it uses in the log (as with BRP4), and you can check that this makes sense. Thanks go especially to Richard Haselgrove and others who experienced the GPU detection problem, reported it here and helped in tracking it down. Sorry it took (me) so long to fix this. Please report any problems or other feedback in this thread. Cheers HBE |
|
Richard Haselgrove Send message Joined: 10 Dec 05 Posts: 450 Credit: 5,409,572 RAC: 0 |
Yes, this one seems to have the device allocation sorted out: Device 0 == GPU 2 == GPUGrid Device 1 == GPU 1 == Albert 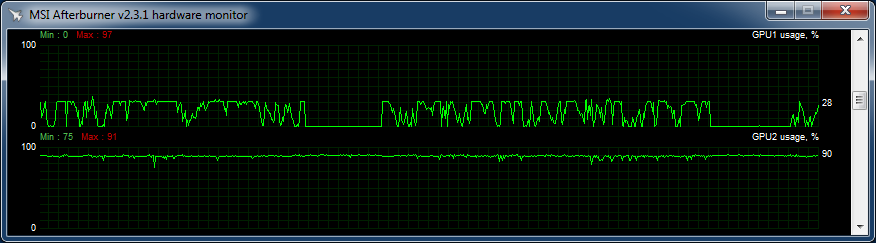 http://albert.phys.uwm.edu/result.php?resultid=789043 |
|
Bikeman (Heinz-Bernd Eggenstein) Volunteer moderator Project administrator Project developer Send message Joined: 28 Aug 06 Posts: 1483 Credit: 1,864,017 RAC: 0 |
Good to hear that! The plot is a good demonstration of what the current app does. Like the very first GPU version of BRP4, it uses the GPU only for some parts of the computation (FFT) and the rest is handled by the CPU. Needless to say, we will try to improve this in future versions. Cheers HB |
|
Jeroen Send message Joined: 25 Nov 05 Posts: 12 Credit: 638,256 RAC: 0 |
I have been running the new version for the past two days. I am actually seeing significantly better performance compared to the previous version I ran a while back. In Linux via a GTX 680 and quad core processor - HT disabled, I have seen the following runtimes: 1-task - ~796 seconds per task 3-tasks - 885-963 seconds per task 36 tasks have validated so far. Unfortunately, I am not able to retrieve GPU load in Linux. I suspect the load is fairly low as the GPU temperature is around 38-41C with 80% fan speed. If I had more CPU cores and cache memory, I think I would be able to run additional tasks at once via a single GPU without significant performance drop per task. The tasks that errored out happened because I accidentally overwrote my 64-bit BOINC with 32-bit BOINC and did not have the 32-bit OpenCL libraries installed. |
|
Bikeman (Heinz-Bernd Eggenstein) Volunteer moderator Project administrator Project developer Send message Joined: 28 Aug 06 Posts: 1483 Credit: 1,864,017 RAC: 0 |
Hi Thanks for the feedback. I have been running the new version for the past two days. I am actually seeing significantly better performance compared to the previous version I ran a while back. This is surprising, we didn't change anything that should have a significant effect on performance. We made the logging less verbose which might help performance a tiny bit, but not more. Some volunteers might see performance increases or even decreases because the tasks are now actually running on the GPU intended by BOINC for it and not the one picked erroneously by the app before (which might be busy with other tasks already), but I understand your host here at Albert has only one GPU installed, so this should not happen in your case.
Note however that setting the nr of concurrent GPU jobs in the profile currently has NO effect on the FGRP app, we didn't enable this feature for the Fermi search, yet. So one would need a app_info.xml or app_config.xml file for the FGRP app. I'm wondering whether BOINC is running BRP4 jobs and FGRP jobs in parallel in a "mixed" configuration (e.g. FGRP needs 1 GPU, BRP4 0.333 GPUs. Will BOINC let all BRP4 tasks finish and hold of running new ones before letting FGRP crunch?) Cheers HB |
|
tolafoph Send message Joined: 18 Nov 11 Posts: 3 Credit: 342,780 RAC: 0 |
Test on a GTX 580. BRP4 @Einstein set to 0.5 GPU and FGRP @Albert is set to 1 GPU. I stopped all GPU-tasks of BRP4 except for one at 60% and one at 0% and let it run. Several FGRP task were waiting to start. After the first task finished the second ran alone. Only after this one finished the FGRP task started. The average GPU load is 24% vs 84% for a BRP4 task. |
|
Jeroen Send message Joined: 25 Nov 05 Posts: 12 Credit: 638,256 RAC: 0 |
Hi Hello, I am not too sure on the difference. A single task used to have a runtime of around 1,100 seconds when I tried previously and now has a runtime of around 800 seconds. I will take a look at my system configuration to see if anything may have changed there since when I ran the previous version.
I had an app_config.xml file setup for a short while as I wanted to see how well the new application would scale on a single GPU. However, since then I removed the app_config.xml file. Thanks for the work done on porting the application to GPU. |
|
TRuEQ & TuVaLu Send message Joined: 11 Sep 06 Posts: 75 Credit: 615,315 RAC: 0 |
I am not sure that the GPU load is correct. I run 3 tasks, 1 on each GPU. I have: gpu(0) ATI 5850 gpu(1) ATI 5970 ; first gpu gpu(2) ATI 5970 ; second gpu I have a SIV picure that shows how it looks.  I saw in post in previous version that similiar thing was found. |
|
TRuEQ & TuVaLu Send message Joined: 11 Sep 06 Posts: 75 Credit: 615,315 RAC: 0 |
I also got this from another programmer. Can it be of use here? "As I recall BOINC uses ADL_Adapter_NumberOfAdapters_Get () and ADL_Adapter_AdapterInfo_Get() to get the list of GPUs." |
|
Jeroen Send message Joined: 25 Nov 05 Posts: 12 Credit: 638,256 RAC: 0 |
I ran 81 tasks in Linux via an AMD 7970. 37 tasks have validated so far and the remaining are pending validation. Runtime: ~610 seconds GPU Load: 58-60% Via the same system, these tasks are running 4-5 times faster on the GPU and CPU combined compared to the CPU alone. |
|
Bikeman (Heinz-Bernd Eggenstein) Volunteer moderator Project administrator Project developer Send message Joined: 28 Aug 06 Posts: 1483 Credit: 1,864,017 RAC: 0 |
Hmm.. that stuff looks odd. The card with the highest load according to the diagram over a timeline has a low temperature, while another GPU with only intermittent load has a very high temperature, and the second GPU doesn't have a temperature reading at all, even tho all GPUs are very similar (Cypress GPU). So I'm not quite sure which part of the data from this tool can be trusted, because there are obvious inconsistencies. Cheers HB |
|
TRuEQ & TuVaLu Send message Joined: 11 Sep 06 Posts: 75 Credit: 615,315 RAC: 0 |
Temps are easily explained. The ATI 5850 has a manual setting of 76% of fan speed, and a not soo good gpu chassi construction. It's cooling are not the best. The 5970 has a great gpu chassi construction which allows the airflow to come into the card and out of the computor chassi's back. The fan is also stronger since there are 2 GPU's in 1 card which makes the 5970 alot warmer then the 5850. Theese are the idle temps.  The low graphs in SIV are verified with GPU-z for each card. |
|
TRuEQ & TuVaLu Send message Joined: 11 Sep 06 Posts: 75 Credit: 615,315 RAC: 0 |
I made another SIV picture for reference. 3gpu tasks from Distrtgen are running.  I'd say optimal temps for 5850 is between 70-74 degrees C , at max load And for the dual GPU card 5970 is between 88-93 degrees C , at max load |
|
Bikeman (Heinz-Bernd Eggenstein) Volunteer moderator Project administrator Project developer Send message Joined: 28 Aug 06 Posts: 1483 Credit: 1,864,017 RAC: 0 |
Interesting, thanks for additional data. We'll have to look deeper into this. Cheers HB |
|
ihatelolcats Send message Joined: 3 Jul 12 Posts: 4 Credit: 9,030,454 RAC: 0 |
since actual GPU use is so low (~20%) can you allow us to change the GPU utilization factor in settings? |
|
Bikeman (Heinz-Bernd Eggenstein) Volunteer moderator Project administrator Project developer Send message Joined: 28 Aug 06 Posts: 1483 Credit: 1,864,017 RAC: 0 |
since actual GPU use is so low (~20%) can you allow us to change the GPU utilization factor in settings? I guess eventually we'll do that, probably with a separate setting as this app consumes more RAM on the graphics card than the BRP4 (or future BRP5) tasks. So those who are able to execute (say) 4 tasks of BRP4 in parallel might only be able to run 3 of the FGRP2 tasks in parallel, hence separate settings. Cheers HB |
|
DF1DX Send message Joined: 5 Mar 13 Posts: 4 Credit: 63,982 RAC: 0 |
FYI 20 tasks on my newly rebuilt host: i5-3570K, Z77 Motherboard PCI-E3, AMD 7970@1GHz Win7-64, Catalyst 13.4, OpenCL 1.2 (1124.2) - runtime ~640s - GPU utilisation between 15% and 56% max. No problems so far and enough headroom for 2-3 tasks in parallel. Best regards Jürgen |
|
Bikeman (Heinz-Bernd Eggenstein) Volunteer moderator Project administrator Project developer Send message Joined: 28 Aug 06 Posts: 1483 Credit: 1,864,017 RAC: 0 |
Nice!!! Thanks for the feedback. Cheers HB |
|
TRuEQ & TuVaLu Send message Joined: 11 Sep 06 Posts: 75 Credit: 615,315 RAC: 0 |
On my computor with 1 PCIE lane X4(5850) and 1 lane X16(5970(2GPU) I've noticed a difference in performance by something like 20-30% I believe the app is using alot of PCIE transfers and that is why the PCIE X16 is alot faster. Less PCIE transfers would be good for this app in the future. I also made some more testing. I found no problem runing 2 instances of app on each GPU  I use app_config.xml file to do that. I ran app(2) on 2GPU's all night. No problem detected. And. I only ran them on the 5970 card since it is PCIE1.1 X16 and faster for the app. When running 2 at a time , max 4 on 2 of 3 gpu's I saw that SIV graph loks as it should. It might have to do with me change driver to 12.10 from 12.8, I am not sure yet. I'll try some more.  And I also have a 6670 card with a I7 Intel computor. That is PCIE2.0 X16 and that is even faster. 10-20% That may proove the PCIE speed of app theory. https://albert.phys.uwm.edu/results.php?hostid=7377 That is all for me for now. Tanks for a great app. //TRuEQ |
skgiven Send message Joined: 14 Oct 12 Posts: 9 Credit: 4,734,887 RAC: 0 |
A few observations about the Gamma-ray pulsar search #2 v1.07 (FGRPopencl-nvidia) app performance, System - W7, Boinc 7.0.64, i7-3770K@4.2GHz, 8GB DDR3 @ 2133MHz, SATA6-SSD, GTX660Ti, GTX660 (PCIE3 X8). GPU utilization factor of BRP apps 1: GPU usage fluctuated up to ~33% on both cards with GPU power moving between 28 and 36% GDDR usage was just under 290 and 300MB. CPU usage was one thread per GPU app and kernel time was low. GPU temps 38°C and 42°C. Performance didn't noticeably improve/deteriorate when suspended/resuming CPU work. GPU usage drops to zero for 1min 10seconds mid-run (@40% and @95% progress). LATeah0069U_16.0_860_-9.14e-10_2 382268 8 Jun 2013 | 18:13:58 UTC 9 Jun 2013 | 7:59:06 UTC Completed and validated 769.03 765.22 70.00 Gamma-ray pulsar search #2 v1.07 (FGRPopencl-nvidia) LATeah0069U_16.0_860_-9.05e-10_2 382259 8 Jun 2013 | 18:12:55 UTC 9 Jun 2013 | 7:12:37 UTC Completed and validated 770.06 766.15 70.00 Gamma-ray pulsar search #2 v1.07 (FGRPopencl-nvidia) A RAC of 7 or 8K from a GTX660Ti is misery. |
This material is based upon work supported by the National Science Foundation (NSF) under Grant PHY-0555655 and by the Max Planck Gesellschaft (MPG). Any opinions, findings, and conclusions or recommendations expressed in this material are those of the investigators and do not necessarily reflect the views of the NSF or the MPG.
Copyright © 2024 Bruce Allen for the LIGO Scientific Collaboration